Introduction
Brüel & Kjær have a line of electrodynamic shaker tables that use their LDS Dactron signal analyzer which produce proprietary .sig files.
Example of a .sig file’s header:
1
2
3
4
5
6
7
8
9
10
$ xxd input1\(t\).sig  | head -n 10
00000000: 44f7 0000 0744 4143 5452 4f4e 5804 0000  D....DACTRONX...
00000010: 0100 0000 0004 0000 0100 0000 0004 0000  ................
00000020: 0100 0000 0100 0000 0004 0000 0969 6e70  .............inp
00000030: 7574 3128 7429 0969 6e70 7574 3128 7429  ut1(t).input1(t)
00000040: 0969 6e70 7574 3128 7429 0156 0156 0000  .input1(t).V.V..
00000050: 1253 6570 7465 6d62 6572 2032 362c 2032  .September 26, 2
00000060: 3030 3608 3130 3a35 373a 3338 0856 5055  006.10:57:38.VPU
00000070: 2d32 3232 3200 0000 0000 0000 00a5 e2ec  -2222...........
00000080: c367 d805 3f00 0000 0000 0000 0000 0000  .g..?...........
As shown in the user manual for their PC software, they provide an ActiveX Signal Reader which provides some functions to enable the .sig file to be opened in “Visual Basic, MATLAB, LabView, C++ and so on”.
Tutorial on how to use in Python
- Download Shaker Control. While a license key is required to use the software, we only need the
DactronSignal.dllfile. - Install the software to a directory of your choosing, I think it installs in
C:\Program Files (x86)by default but I am not sure since I chose to install it toD:\Programs. Annoyingly you do need to install the program, inspecting the installation files in 7-zip doesn’t show this DLL specifically. - Go to
Bruel and Kjaer\LASER and COMET Vibration Control\Shaker Control LaserUSB\binand copyDactronSignal.dllto a directory of your choosing. - Create a command prompt and
cdto the directory containing the DLL and register the DLL:
1
regsvr32 .\DactronSignal.dll
After copying the DactronSignal.dll file to another directory you may uninstall the program.
The Bruel and Kjaer\LASER and COMET Vibration Control\Signal Reader directory contains examples for Visual C++ and MATLAB. There are also some sample .sig files.
- Create a 32-bit Python virtual environment and activate the virtual environment OR use a 32-bit Python installation. It must be 32-bit since the DLL is 32-bit, if you use 64-bit it will not find the class, and you will get this error:
1
2
3
4
5
6
7
8
9
10
11
12
PS C:\<path>\signal_reader> python
Python 3.9.6 (tags/v3.9.6:db3ff76, Jun 28 2021, 15:26:21) [MSC v.1929 64 bit (AMD64)] on win32
--- ✂
PS C:\<path>\signal_reader> python .\test.py
--- ✂
pywintypes.com_error: (-2147221021, 'Operation unavailable', None, None)

During handling of the above exception, another exception occurred:
--- ✂
pywintypes.com_error: (-2147221164, 'Class not registered', None, None)
PS C:\<path>\signal_reader>
- Install
pywin32(andnumpyandmatplotlibfor plotting)
1
2
python -m pip install pywin32
python -m pip install numpy matplotlib
- Create a script to see if loading the DLL works. Use the provided
FFT1(f).sigfile for testing:
⬇ Download FFT1(f).sig for testing this script
1
2
3
4
5
6
7
8
9
10
11
12
13
import win32com.client
import numpy as np
import matplotlib.pyplot as plt

dac_signal = win32com.client.Dispatch("SignalReader.DacSignal.1")

success = dac_signal.LoadSignal("FFT1(f).sig")

if success:
    print("Signal loaded successfully")
else:
    print("Error loading signal")
    exit(1)
⬇ Additional file: G1,1(f).sig
⬇ Additional file: input1(t).sig
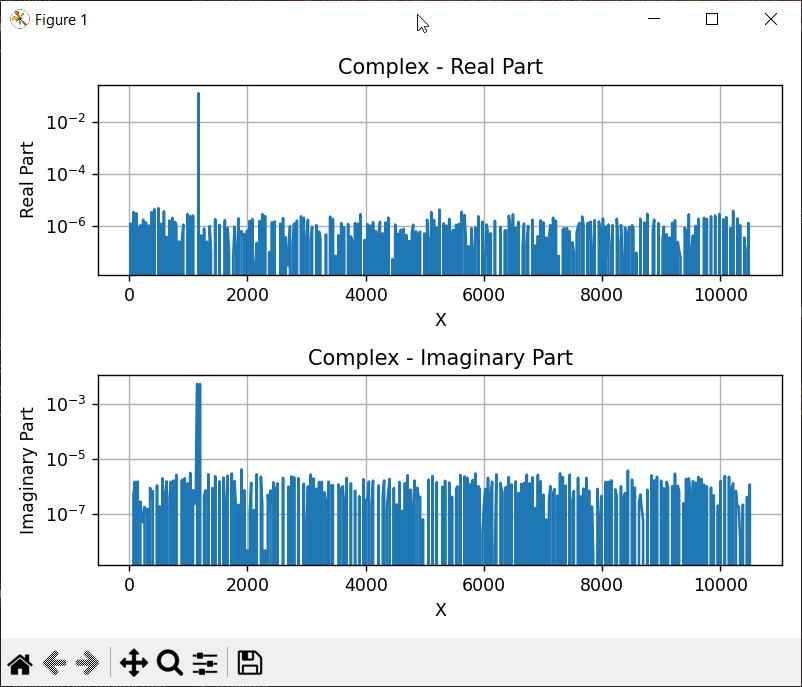
- If it loaded successfully, you may try the following script which was adapted to Python from the example MATLAB script given in the documentation
Recall_and_plot_G11.m. This should provide the following plot:
1
2
3
4
5
6
7
8
9
10
11
12
13
14
15
16
17
18
19
20
21
22
23
24
25
26
27
28
29
30
31
32
33
34
35
36
37
38
39
40
41
42
43
44
45
46
47
48
49
50
51
52
53
54
55
56
57
58
59
60
61
62
63
64
65
66
67
68
69
70
71
72
73
74
75
76
77
78
79
import win32com.client
import numpy as np
import matplotlib.pyplot as plt

dac_signal = win32com.client.Dispatch("SignalReader.DacSignal.1")

success = dac_signal.LoadSignal("FFT1(f).sig")

if success:
    print("Signal loaded successfully")
else:
    print("Error loading signal")
    exit(1)

# Get slice number of the signal, for G1,1(f) signal, the value is 1.
nSliceNum = dac_signal.NumofSlice
# Get number of samples.
nNumofSamples = dac_signal.NumOfSamples

# slice index is 0 based
indexSlice = 0
# Sample index is 0 based
indexFirstSmp = 0

# Get X Begin
xBegin = dac_signal.XaxisBegin
# Get X Delta
xDelta = dac_signal.XaxisDelta
xSpacingEven = dac_signal.XaxisSpacingEven

varX = np.zeros(nNumofSamples)

if xSpacingEven == 1:
    # When X-axis is evenly spaced, generate values with X(i+1) = X(i) + XDelta
    varX = np.arange(xBegin, xBegin + xDelta * nNumofSamples, xDelta)
else:
    # When X-axis is unevenly spaced, generate values with X(i+1) = X(i) * XDelta
    for i in range(nNumofSamples):
        varX[i] = xBegin * (xDelta**i)

# Get Y data (first slice)
varY = dac_signal.GetData(indexSlice, indexFirstSmp, nNumofSamples - 1)

# Convert varY from a COM array to a numpy array
varY = np.array(varY)

# Get data type (1: real, 2: complex)
DataType = dac_signal.DataType

# Plot the data based on the data type
if DataType == 1:  # Real data
    plt.figure()
    plt.loglog(varX, varY)
    plt.title("Real")
    plt.xlabel("X")
    plt.ylabel("Y")
    plt.grid(True)
    plt.show()
else:  # Complex data
    varRealY = varY[::2]  # Real part
    varImgY = varY[1::2]  # Imaginary part

    plt.figure()
    plt.subplot(2, 1, 1)
    plt.semilogy(varX, varRealY)
    plt.title("Complex - Real Part")
    plt.xlabel("X")
    plt.ylabel("Real Part")
    plt.grid(True)

    plt.subplot(2, 1, 2)
    plt.semilogy(varX, varImgY)
    plt.title("Complex - Imaginary Part")
    plt.xlabel("X")
    plt.ylabel("Imaginary Part")
    plt.grid(True)

    plt.tight_layout()
    plt.show()
- You may unregister the DLL after use like so if you don’t trust an old dll lying around on your system.
1
regsvr32 /u .\DactronSignal.dll